Features
• Built-in software, no application to install
• Runs directly from your web browser
• Accessable by Ethernet, USB connection or integrated modem
• Intuitive graphical interface
• Easy-to-use configuration editor
• Access live and historical data
• View data as charts, mimics and tables

dEX datalogger software is an intuitive graphical interface that allows you to configure your data logger, view real-time data in mimics, trend charts or tables and retrieve your historical data for analysis.
Browser-based Solution
dEX comes pre-installed on every logger in the DT80 range. The software loads in your web browser so there is no need to install cumbersome applications on your computer. Being browser-based, dEX will work on all major operating systems including Windows, Mac and Linux.
Configuration Editor

The configuration editor allows you to view, edit and save logger configurations in an easy-to-use Windows Explorer style user interface. The configuration tree view allows definition of measurement schedules and measurements.
Wiring diagrams show available wiring configurations for each sensor type. Configuration can be stored and retrieved on either the logger or a local computer.
Mimics and Charts

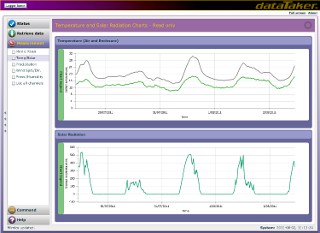
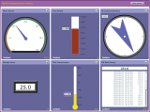
Mimics are organised into panels which can be modified to highlight custome alarm conditions or data grouping. Mimics include dials, bar graphs, thermometers, etc. Real-time chart recorder mimic allows you to view trends and historical data over a custom time/date range. Up to 16 mimics can be displayed on up to 5 mimic pages.
Minimum System Requirements
• Web Browser – Internet Explorer (IE7 or later), Safari, Google Chrome, Firefox
• Adobe Flash Player (10 or higher)
• Screen resolution of 1024 x 768


